


An L&D manager can have a dashboard full of numbers and still struggle to answer a basic question: What is actually happening with our learners?
Completion may look healthy, but it cannot show whether learners struggled, repeated an activity, disengaged, or rushed through required content. Useful learning analytics reports add that context and help teams decide what to investigate, improve, or support.
That requires consistent data and a way to trace a metric back to its source events.
Sereni LRS by Aptlogica Technologies captures, validates, normalizes, stores, and analyzes xAPI statements from connected learning systems. Its configurable Analytics Workspace turns this data into learner, course, assessment, organizational, and operational insights. Teams can also use the built-in Statement Explorer to inspect individual learning records, investigate data-quality issues, and understand the events behind a dashboard result.
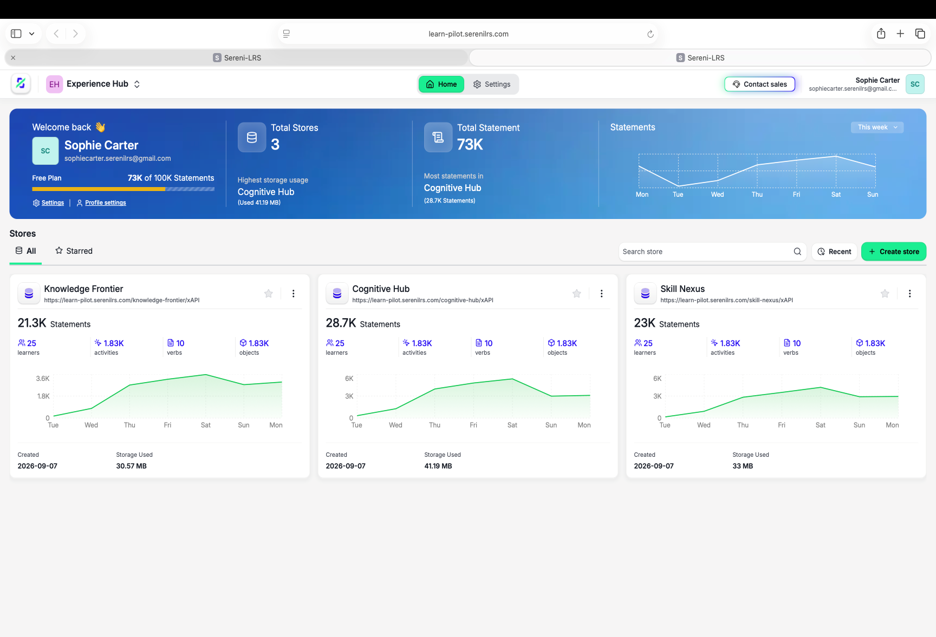
Here are five reports that make that data useful to L&D teams.
1. Learner Progress Report
A compliance deadline is approaching, and a manager asks why an employee’s training remains incomplete. A completion percentage alone cannot explain where support should begin.
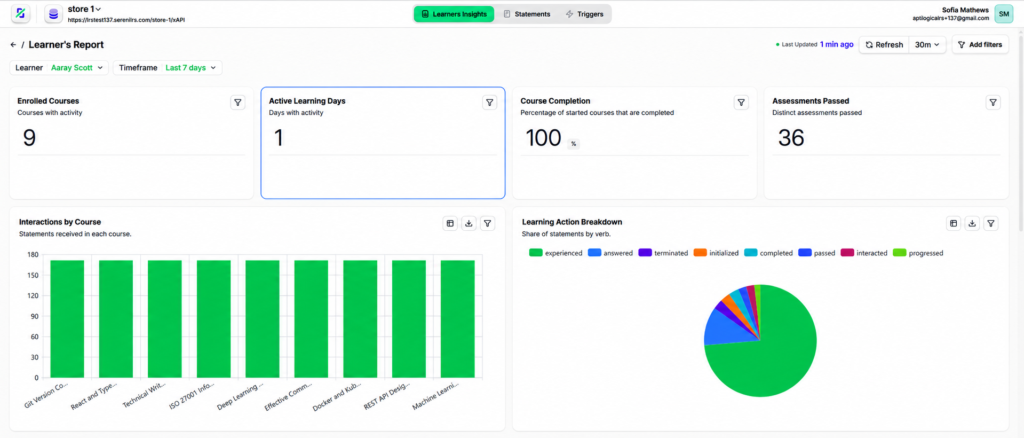
In Learner’s Report, review courses with activity, active learning days, course completion, and distinct assessments passed. Course Progress Details breaks this down by course, showing status, assessment counts, and recorded statements.
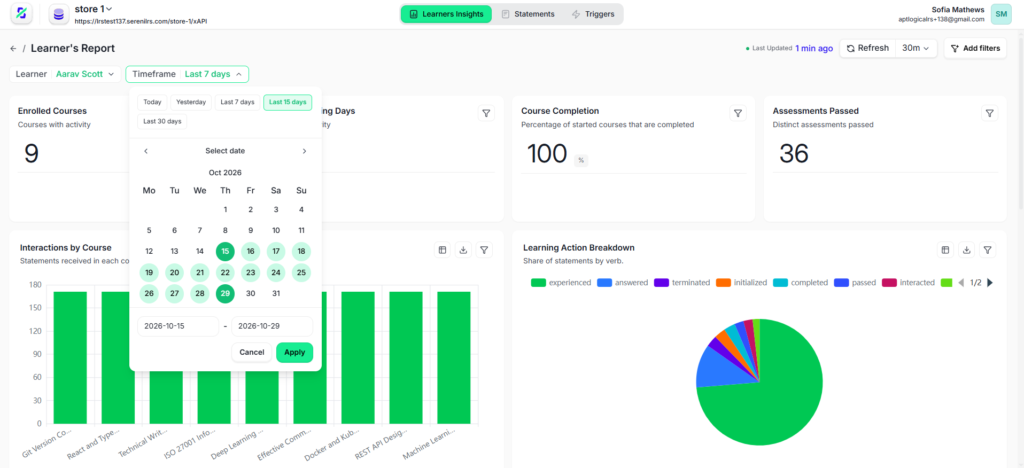
Before investigating, set the reporting period. Improved timeframe filtering offers preset periods and a custom date range, with a tidier filter panel. A monthly review and a seven-day activity check answer different questions.
2. Course Completion and Outcomes Report
The wider rollout looks successful: most learners have finished. But have they also passed the assessments?
Course’s Report places completion rate alongside exam pass rate, unique learners who started, and active learners. Learner Level Details adds individual completion status, last activity, assessment counts, and highest score.
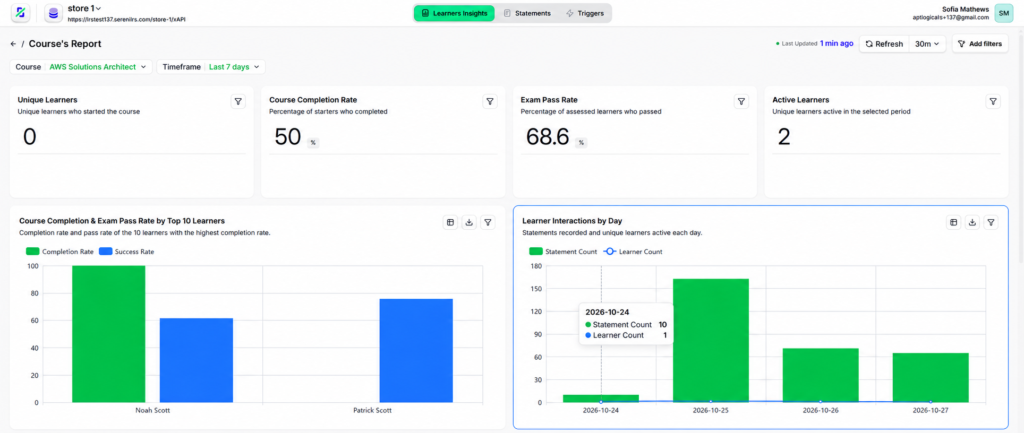
Start with a ready-made analysis preset, then use Global Filters to focus the dashboard on the relevant course and timeframe. Dashboard-wide filters keep charts within a shared reporting context, helping the team investigate outcomes without mixing unrelated courses.
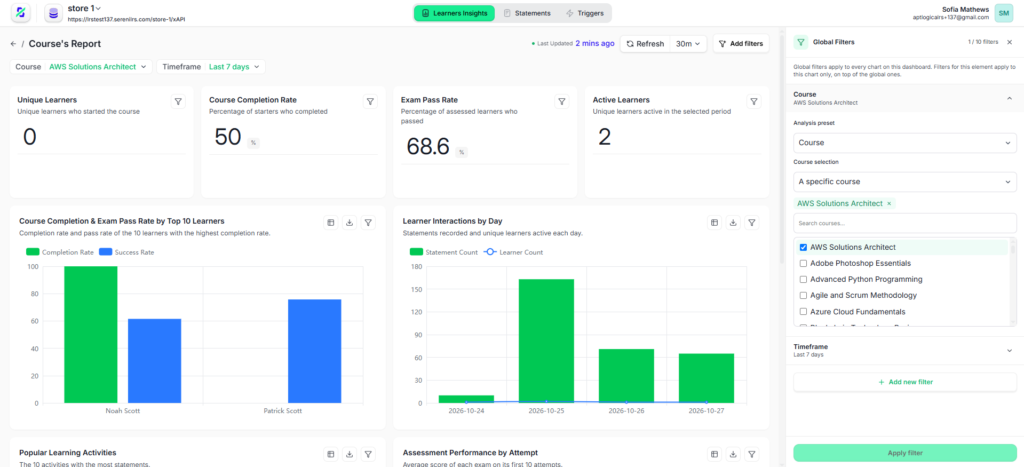
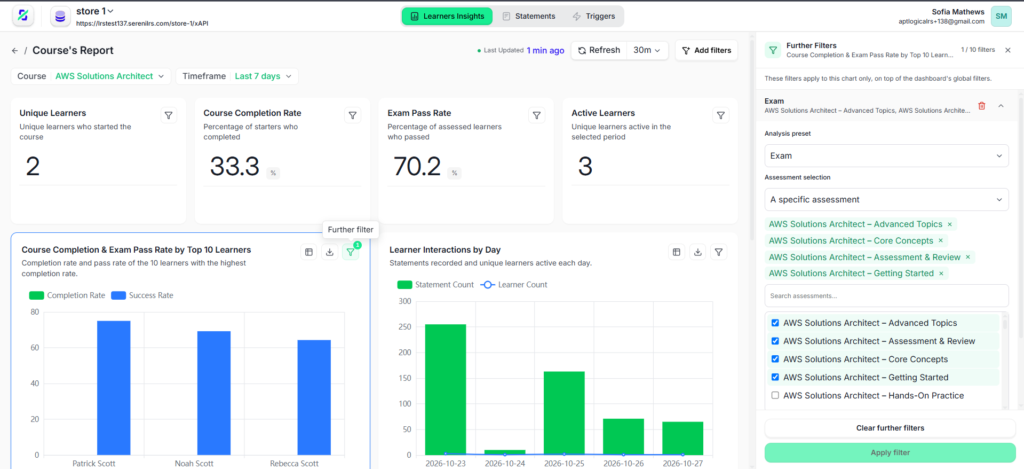
Use Further Filters to narrow an individual chart—for example, examining selected assessments within a course dashboard. These filters work on top of Global Filters. Check both, along with the timeframe, when chart values appear different.
3. Assessment Performance Report .
One assessment shows weaker results. Before changing the course, the team needs to understand whether the difficulty affects everyone or particular learners.
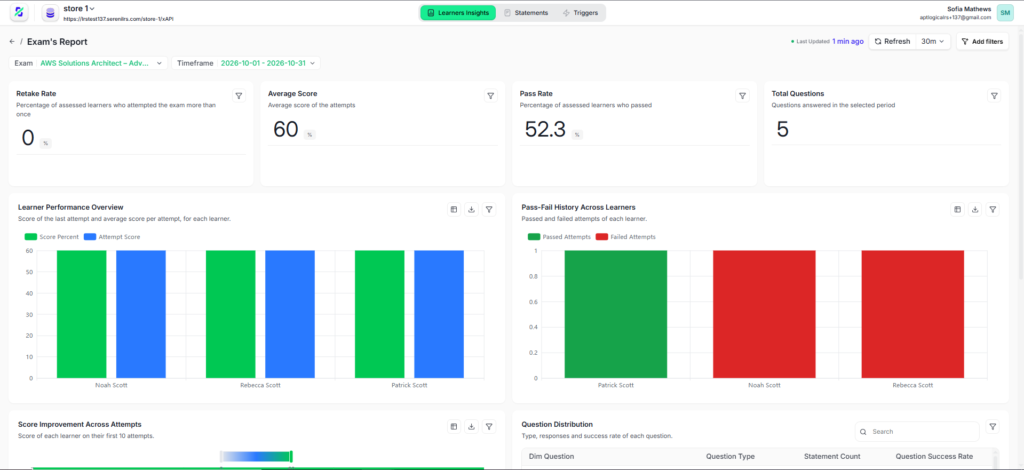
In Exam’s Report, average score and pass rate establish the overall picture. Learner Performance Overview compares each learner’s last-attempt score with their average across attempts. Pass-Fail History Across Learners shows passed and failed attempt counts.
These views help assessment owners identify patterns requiring investigation. For learning technology teams, consistent score and success data matter: a numerical score and a recorded pass result describe different aspects of performance.
4. Custom KPI Report
A monthly L&D review may need a focused combination of measures: course completion, assessment success, and participation trends. A custom report brings the relevant measures together around the team’s reporting question.
In Sereni LRS, Add Visualization lets teams choose a chart type or start from predefined templates. Use a Number card for a headline KPI, a Line Chart for trends, or a Table for detailed records. Bar, donut, scatter, box plot, gauge, heat map, and composed charts offer additional ways to explore available data.
Define what each KPI measures, how it is calculated, and which timeframe and filters apply. The visualization should make the result easier to interpret; its reliability still depends on the underlying learning records.
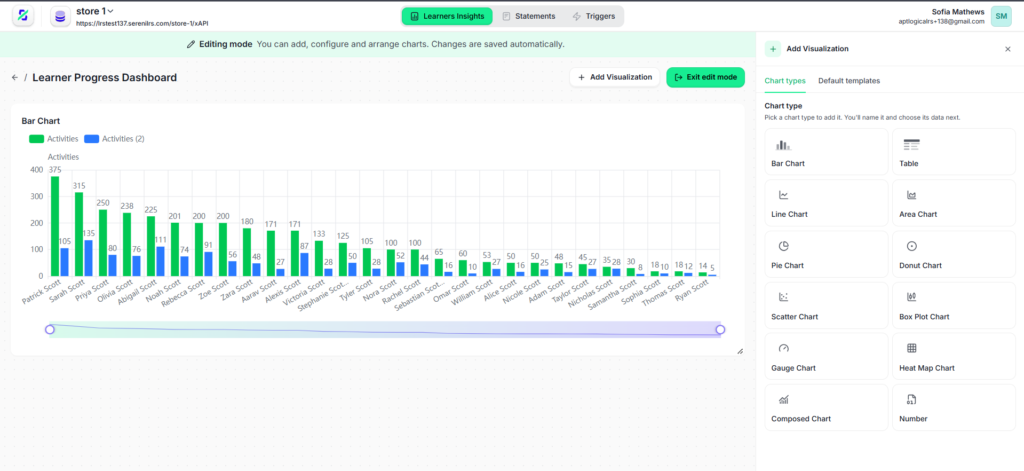
Once these reports are configured, related dashboards can be organized into groups. For example, keep learner progress and training effectiveness together under learning outcomes, making it easier for L&D teams to move between them during reviews. Filters within each dashboard define the data being analyzed.
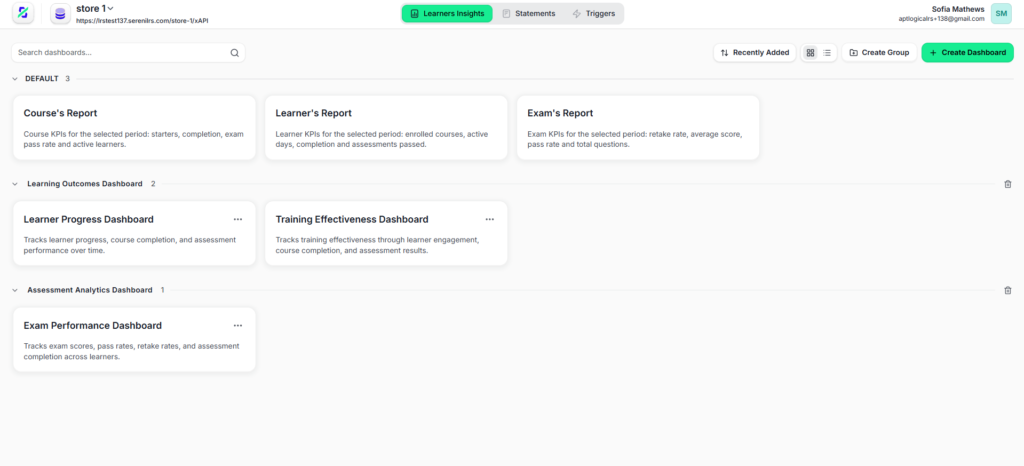
5. Learning Data Quality and LRS Operations Report
This is the report many L&D teams overlook. It is also the one that determines whether the other four can be trusted.
Duplicate statements inflate activity, missing metadata obscures courses, inconsistent identifiers fragment records, and validation failures prevent expected events from reaching analytics.
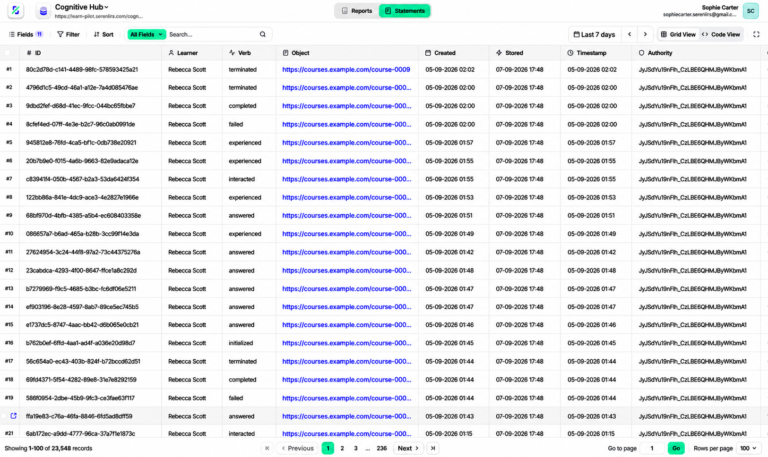
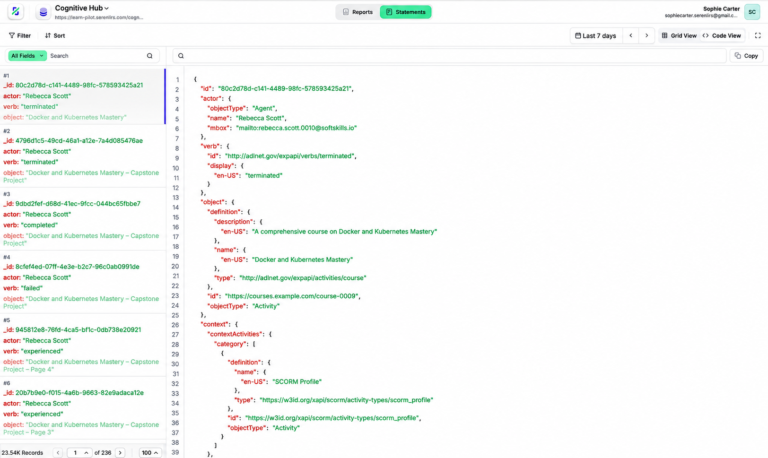
Sereni’s operational dashboards cover statement throughput, query latency, storage growth, validation failures, duplicate registrations, orphaned activities, missing metadata, and source errors. Statement Explorer exposes a structured grid and complete JSON, metadata, validation status, attachments, and processing history.
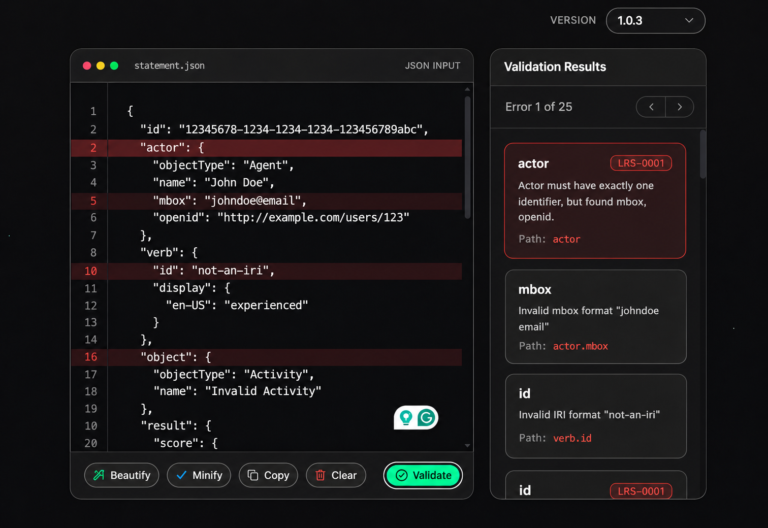
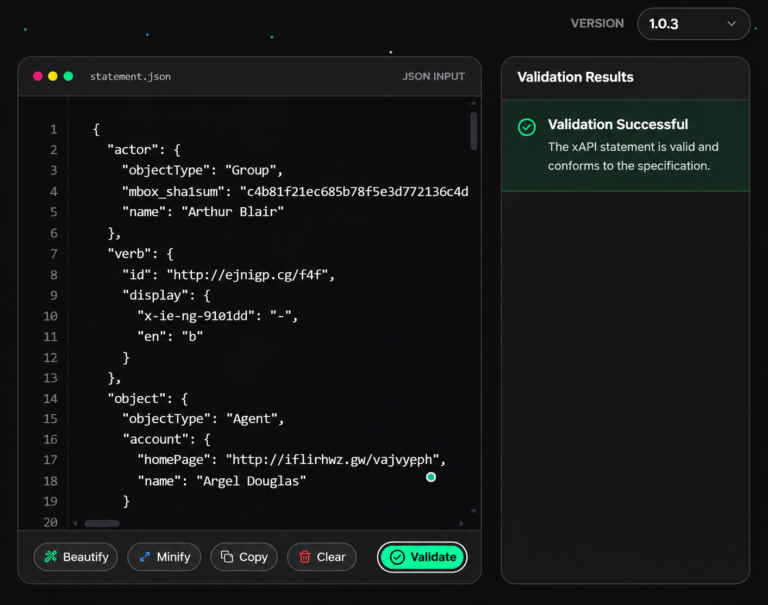
Before sending xAPI data into an LRS, teams can also validate individual statements using Aptlogica’s free xAPI Statement Validator. It helps identify structural and validation issues in an xAPI statement before those records are used for learning analytics or reporting. This is particularly useful for developers, instructional technology teams, and L&D teams troubleshooting an xAPI integration.
Validate an xAPI statement for FREE→ xAPI Statement Validator
Make Better Decisions with Sereni LRS
Sereni LRS brings learner progress, course outcomes, assessment performance, and custom KPIs into a configurable Analytics Workspace. Combined with operational reporting and Statement Explorer, these views help teams investigate results, identify data issues, and decide where follow-up is needed.
Explore Sereni LRS learning analytics, reporting, and other platform features, or get started for free to begin working with your learning data.
For a free product demo, enterprise deployment, or migration support, contact the Sereni team at sales@serenilrs.com