


Learning reports should help teams understand performance, but repeated dashboard setup and limited visualisation can make that work harder than it needs to be.
Sereni LRS v1.0.3 makes learning data easier to explore through an updated Learner Insights experience. With ready-made templates, dashboard cloning, new chart types, organised groups, and personal filters, the release helps L&D teams move from preparing reports to investigating the results.
For earlier improvements to privacy, migration, and automation, explore the previous Sereni LRS release.
What’s New in Sereni LRS v1.0.3?
The release brings several connected improvements to Learner Insights:
- Default templates and cloning to reduce repeated dashboard setup.
- Donut, box plot, and scatter charts for different reporting questions.
- Dashboard groups and drag-and-drop organisation.
- Personal filters that retain each user’s refined view.
- Improved timeframe selection and interactive chart exploration.
Here’s a closer look at how these features support everyday reporting.
1. Default Reports and Clone Useful Dashboards
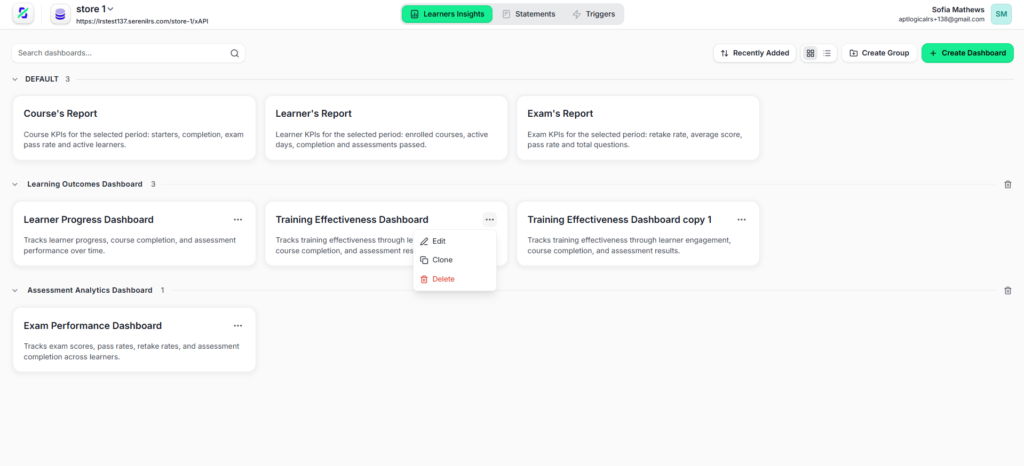
Administrators can begin with ready-made reporting templates instead of configuring every dashboard from scratch.
The default section includes three reporting starting points:
- Course’s Report: Course starters, completion, exam pass rate, and active learners.
- Learner’s Report: Enrolled courses, active learning days, completion, and assessments passed.
- Exam’s Report: Retake rate, average score, pass rate, and total questions.
These templates give teams a practical starting point based on the subject they want to investigate.
When an existing dashboard already provides a useful structure, the Clone option creates a copy that can be adapted. For example, a team can reuse a training dashboard’s layout for another programme, then review its configuration and filters to match the new reporting requirement
2. Organise Related Dashboards into Groups
As reporting requirements grow, a single list of dashboards becomes harder to navigate.
Dashboard groups let teams place related views together. The example below separates Learning Outcomes Dashboard from Assessment Analytics Dashboard, keeping learner progress and training effectiveness views apart from exam performance reporting.
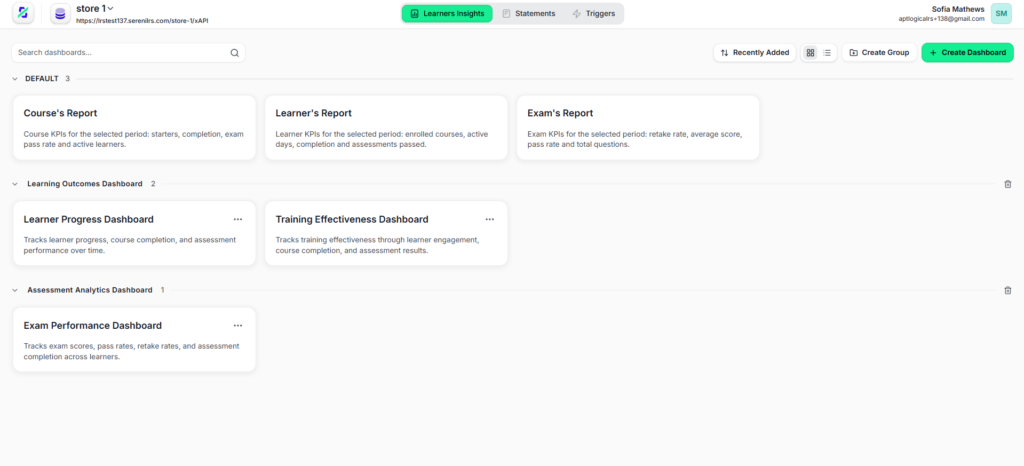
Groups provide a clearer structure for navigating related dashboards.
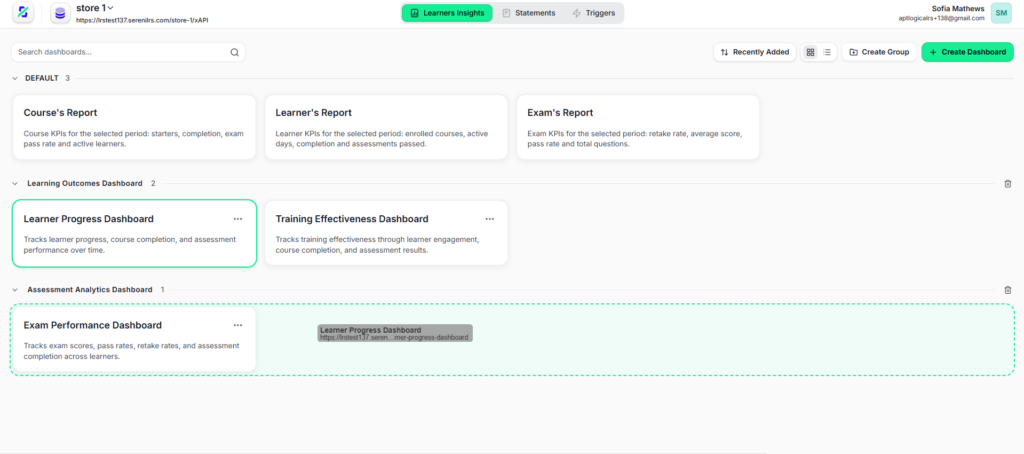
Drag-and-drop interaction also supports dashboard organisation. Administrators can move dashboard cards between groups as reporting needs change.
For instance, a learner progress dashboard initially used for assessment analysis may later belong with broader learning outcome reports. Moving the card helps keep the reporting workspace aligned with how the team uses it.
3. Explore Learning Data with Three New Chart Types
Different learning questions require different visualizations. Sereni LRS v1.0.3 adds donut, box plot, and scatter charts to support more ways of examining the available data.
Donut Charts: Understand How a Measure Is Distributed
Donut charts show how a configured measure is divided across categories.
The chart builder offers segment options including Course, Exam, Learner, Activity, Question, and Learner attempt. In the example below, the chart is segmented by learner, with values configured to count unique activities.
This can help a training team review how recorded activity is distributed across learners. Interpretation depends on the selected measure: activity counts describe recorded participation,
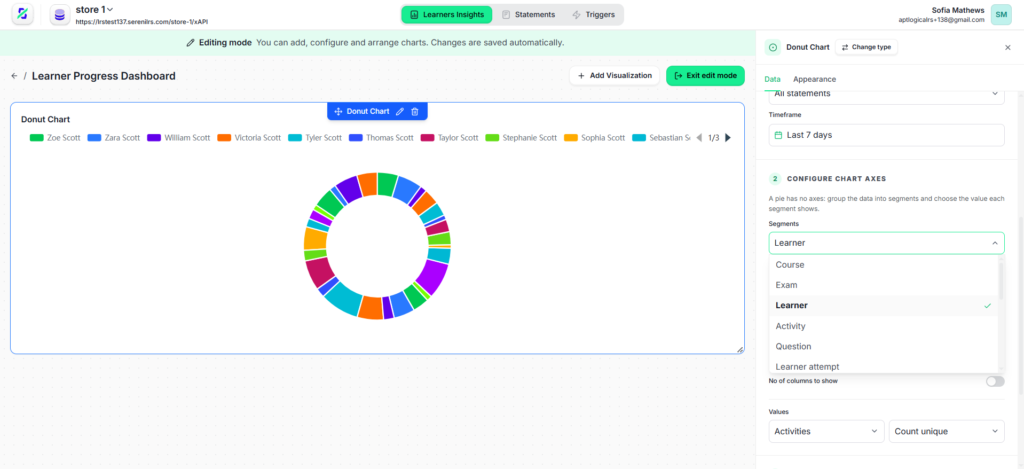
Configure the segment and value to define what each donut slice represents.
Box Plots: Look Beyond an Average .
An average can hide differences in how results are distributed.
Box plots help teams examine the spread of a configured measure across groups. The release adds course grouping options, supporting comparisons between courses.
For assessment reporting, this can help identify courses where results vary widely and deserve further investigation. Teams should check the selected measure, population, and timeframe before drawing conclusions.
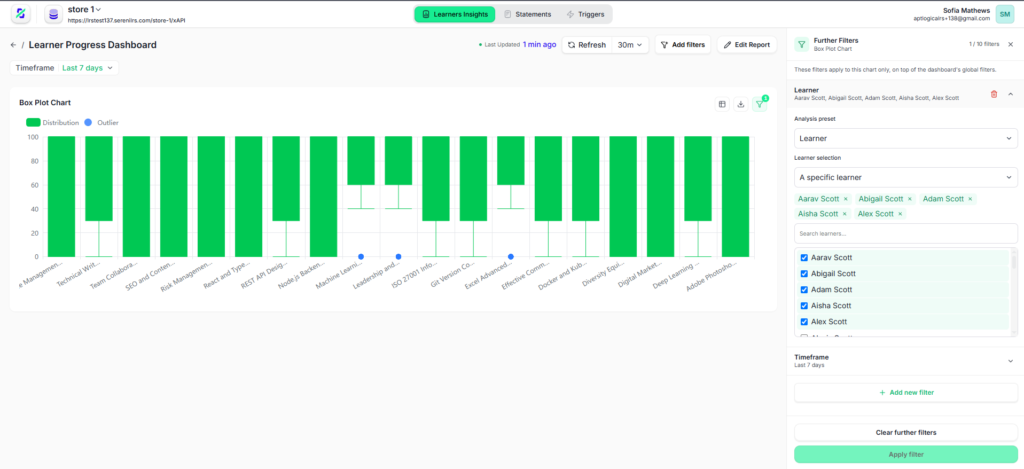
The box plot view combines course comparisons with filters for selected learners.
Scatter Charts: Compare Values Across Learners
The new scatter chart gives teams another way to compare learner data through individual plotted points.
In the example below, learners appear on the horizontal axis, while the vertical axis shows each learner’s unique course count. This helps reviewers see differences in recorded course activity across the group and identify learners whose records deserve closer examination.
Administrators can configure the grouping, aggregation, axis titles, and sorting to match the reporting question. Course counts should be interpreted alongside completion and assessment results to understand what that activity represents.
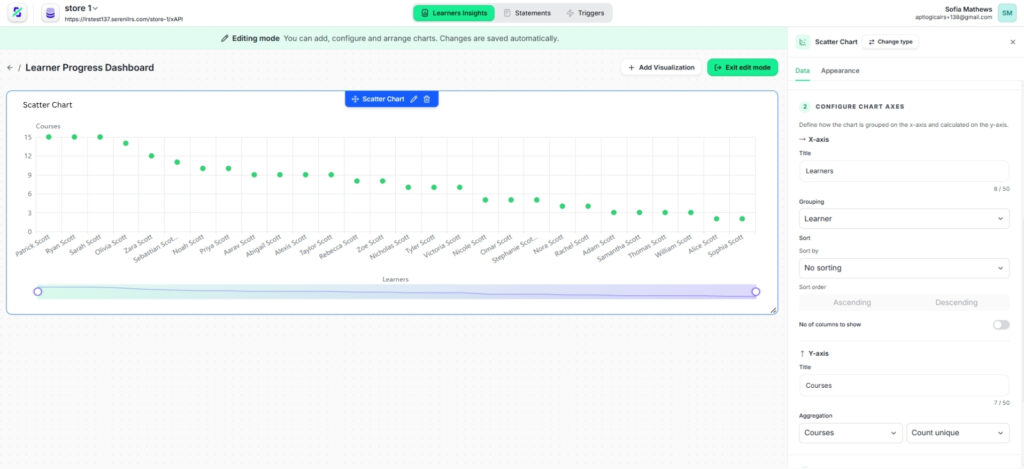
This configuration compares unique course counts across learners.
Explore Sereni LRS features to learn more about its learning analytics and reporting capabilities.
Inspect Chart Details with Interactive Zoom
When a chart contains many learners, interactive zoom helps reviewers focus on a smaller section. The range selector supports closer exploration, while hover details display the learner’s name and corresponding value.
In the screenshot below, the selected region highlights part of the chart, and the tool tip identifies an individual learner’s course count. This makes specific points easier to inspect during a detailed review.
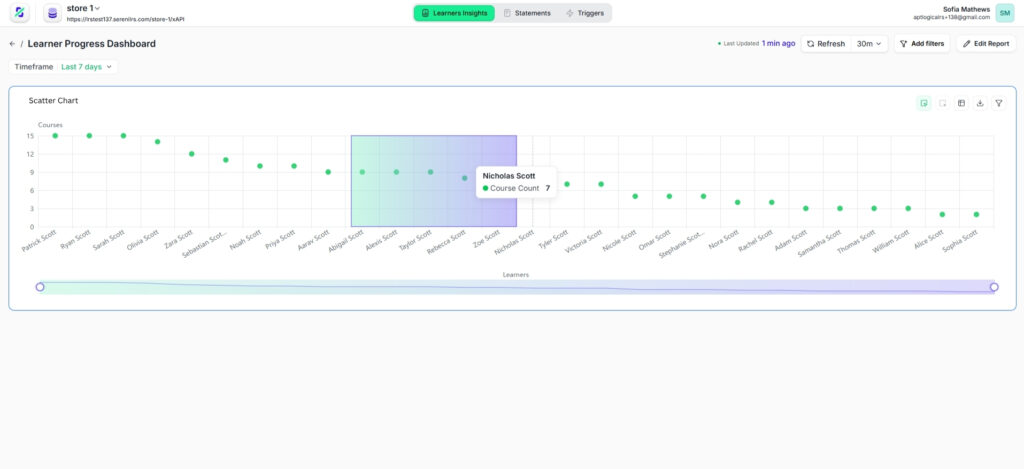
Zoom into a selected region and hover over a point to inspect its details.
Refine Individual Charts with Further Filters and Global Filters
A dashboard may cover an entire course, while one chart needs to focus on selected assessments or learners.
Further Filters apply to an individual chart on top of the dashboard’s global filters. For example, the Course’s Report can remain focused on AWS Solutions Architect while a selected chart is further filtered to specific assessments. These refined selections are remembered for each user without changing another person’s view.
.
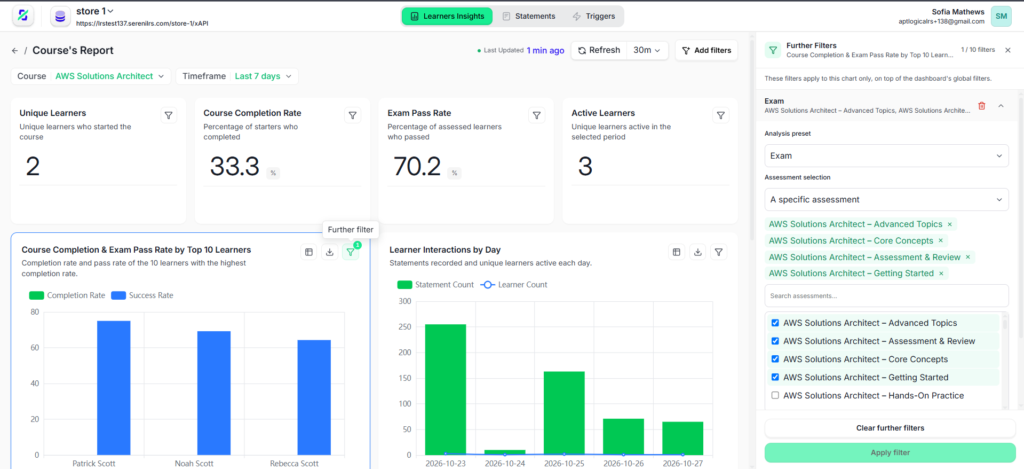
Further Filters narrow an individual chart while retaining the dashboard’s broader reporting context.
Global Filters set the broader reporting context across every chart on the dashboard. Selecting AWS Solutions Architect and Last 7 days, for instance, focuses the dashboard on that course and period. Together, both filter levels help teams review overall results and investigate specific details within the same reporting view.
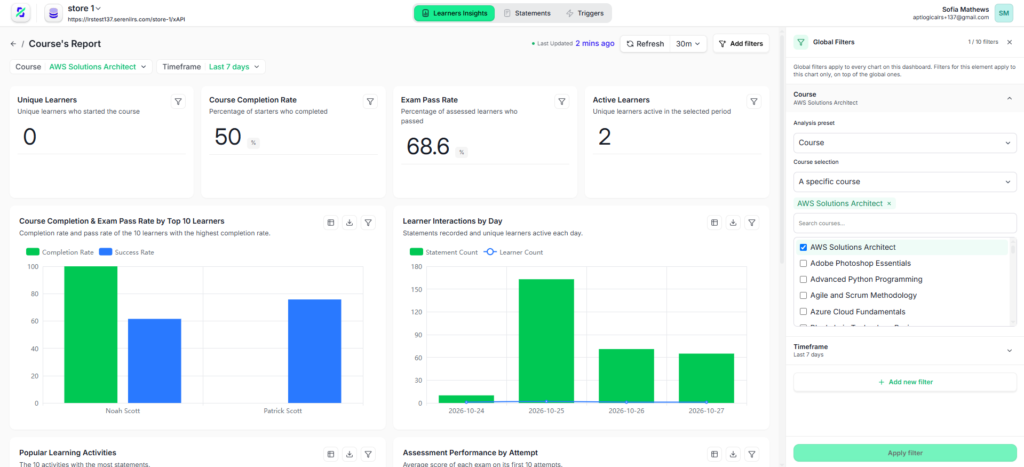
Global Filters apply a shared course selection and reporting period across all charts on the dashboard.
Select the Reporting Period More Easily
Timeframe affect how learning metrics should be interpreted. A weekly activity review and a monthly programme review need different reporting windows.
The timeframe selector provides shortcuts such as Today, Yesterday, Last 7 days, Last 15 days, and Last 30 days, alongside calendar-based date selection.
Use a preset period or select dates for the reporting window you need.
Before comparing results, confirm that the reports use equivalent periods and consistent definitions.
Turn Learner Insights into a Useful Reporting Routine .
Sereni LRS v1.0.3 supports a more practical reporting workflow: begin with a template, reuse useful dashboards, organise them into groups, and refine the data through appropriate charts and filters.
The value comes from connecting those views to a clear question—such as which courses need investigation or how learner activity differs across a programme. Consistent xAPI records and reporting definitions remain essential to interpreting the results accurately.
Get Started Free with Sereni LRS, or contact sales@serenilrs.com for a product demo and to discuss your learning analytics requirements.